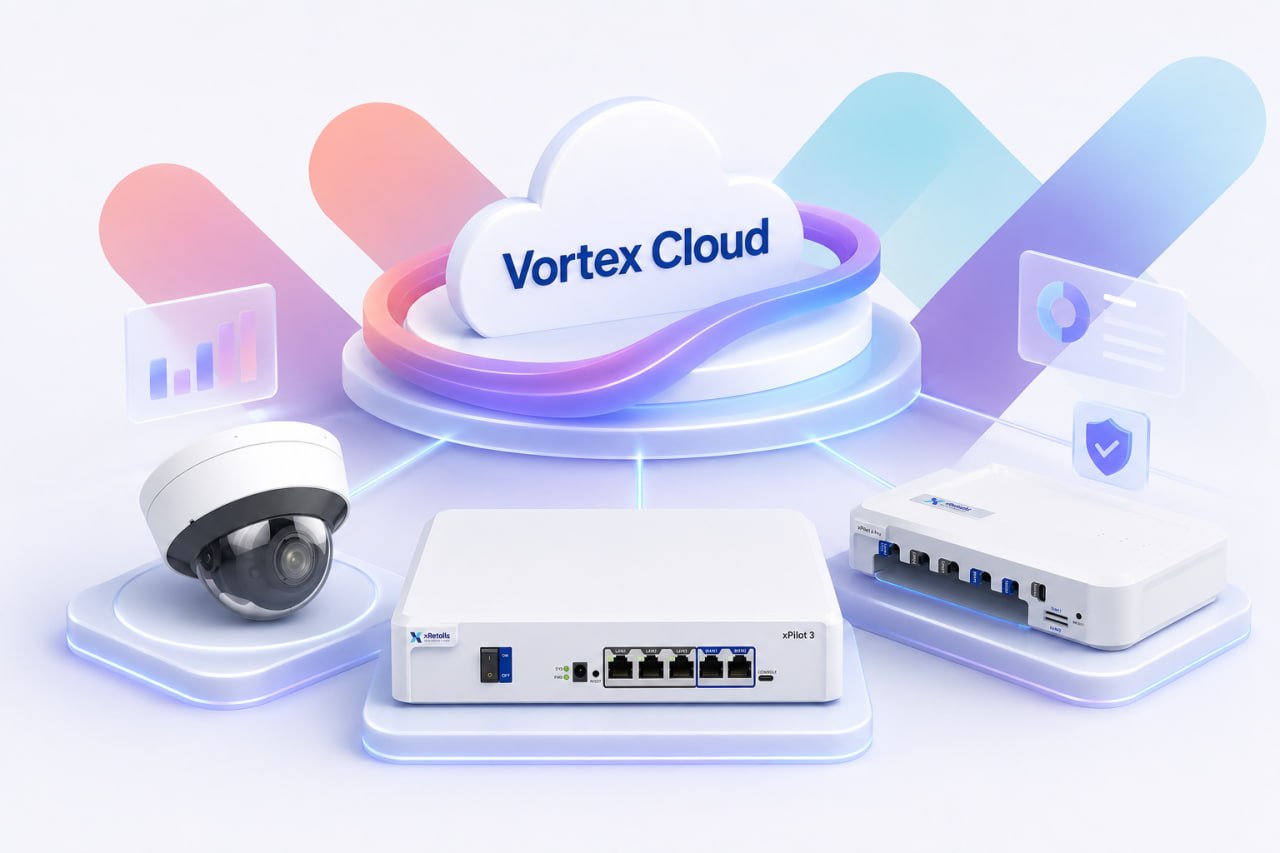
Vortex Cloud — Unified SaaS Dashboard
Centralized monitoring and AI insights for all your stores. One pane of glass to rule them all — from connectivity to shopper intelligence.
“One Dashboard. All Your Stores.”
The Data Silo Trap
Most retailers juggle multiple disconnected systems: one for network monitoring, another for POS, and a third for footfall analytics. This fragmentation blinds you to the bigger picture and makes troubleshooting a nightmare.
Fragmented Visibility
When sales drop, you don't know if it's a network outage, a staffing issue, or a cold zone. Without a unified view, you're guessing at the root cause and wasting hours cross-referencing spreadsheets.
Reactive Firefighting
Traditional dashboards only show you what's broken right now. You need predictive alerts that tell you when a device is about to fail, so your IT team can fix it before the store even notices.
Regional Blind Spots
Managing 500 stores across APAC means dealing with different time zones, languages, and local vendors. Without a centralized cloud platform, regional managers are flying blind on local performance.
Key Features
Vortex Cloud unifies every xRetails device and data stream into one powerful, intuitive platform.
One Pane of Glass
Monitor connectivity, footfall, device health, and POS uptime in a single dashboard. Switch between map view, list view, and detailed store breakdowns instantly.
AI-Powered Alerts
Intelligent anomaly detection notifies your team before issues impact operations. Get alerts for connectivity drops, unusual traffic patterns, and device failures via email or Slack.
Automated Reporting
Generate detailed, exportable reports on footfall trends, conversion rates, network uptime, and device inventory. Schedule automated delivery to stakeholders every Monday morning.
Multi-Store Management
Manage hundreds or thousands of stores from a single pane of glass. Group by region, format, or performance tier for at-a-glance operational visibility.
Role-Based Access
IT admins see technical diagnostics. Regional managers see sales funnels and conversion rates. Store managers see queue lengths and staff alerts. Everyone gets the data they need.
Real-Time Monitoring
Live dashboard showing connectivity status, footfall counts, device health, and network performance across every store in your portfolio — updated in real time.
How Vortex Works
From raw edge data to actionable insights in three seamless steps.
Connect
Your xTrack cameras and xPilot gateways securely push encrypted metadata to Vortex Cloud via TLS. No video streams, no heavy bandwidth usage — just lightweight, actionable data.
Aggregate
Vortex unifies the data streams, applying regional timezones, store hierarchies, and custom tags. It correlates network uptime with shopper traffic to give you a complete health picture.
Visualize
Log into your personalized dashboard. Use the drag-and-drop builder to create custom views. Set thresholds for alerts, and export PDF reports for your weekly board meeting.
Built for Every Role
Vortex isn't just for IT. It's a strategic asset for your entire organization.
IT Operations
Monitor device health, push firmware updates remotely, and get paged the second a store's primary connection drops. Cut truck rolls by 80% with centralized diagnostics.
Regional Managers
Compare conversion rates across 50 stores in Southeast Asia. Identify which locations are underperforming and drill down into footfall heatmaps to understand why.
Marketing Teams
Measure the real-world impact of your campaigns. Did the weekend promo actually drive more foot traffic? Vortex gives you the hard numbers to prove ROI to the board.
See Every Store, All at Once
Stop juggling disconnected systems. Deploy Vortex Cloud and unify your retail operations, network monitoring, and shopper intelligence in one powerful platform.
Get Started Today